Empowering Your Data Journey
Expert data solutions for informed business decisions.
Build insightful KPI dashboards tailored for You.
Automate reports to save time and resources.
Analyze performance for better ROI.


Our Services
Expert data analysis solutions designed to support informed decision-making, optimize business processes, and drive measurable growth. We help businesses transform raw data into clear, actionable insights through advanced analytics, visualization, and automation.
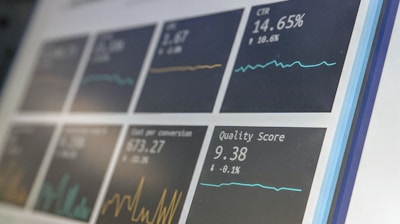
KPI Dashboard Building
Monitor your most important metrics in real-time with custom KPI dashboards. We design and build interactive, user-friendly dashboards using tools like Power BI, Tableau, and Looker Studio to:
Track key performance indicators across sales, marketing, finance, and operations.
Consolidate multiple data sources into a single view.
Identify trends, opportunities, and issues instantly.
With the right data visualization, decision-makers can act faster and with more confidence.
Data Automation
Save time and reduce human error by automating your data workflows. Our data automation services include:
Building automated reporting pipelines.
Integrating live data from CRMs, ERPs, e-commerce, and marketing platforms.
Scheduling regular data refreshes for up-to-date analysis.
Automation streamlines processes, improves efficiency, and ensures your reports are always accurate and ready when you need them.
Data Cleaning
Ensure your business decisions are based on accurate, consistent, and high-quality data. Our data cleaning services involve:
Detecting and correcting errors, duplicates, and inconsistencies.
Standardizing formats for easier integration across systems.
Removing outdated or irrelevant information to improve analysis accuracy.
Clean data improves reporting reliability, supports accurate forecasting, and ensures compliance with data governance standards.
Make informed product decisions with data-backed insights.
We specialize in:
Sales tracking by product or category.
Pricing optimization for better margins and competitiveness.
Customer feedback analysis to improve quality.
Competitor benchmarking to stay ahead in the market.
Unlock deeper insights into your company’s financial health.
We help with:
Profitability analysis to find high-margin opportunities.
Cash flow analysis to ensure liquidity.
Budgeting & forecasting for better financial planning.
Investment evaluation using ROI, NPV, IRR, and payback period.
Our financial analysis services empower smarter investment and growth decisions.
Financial Analysis
Forecasting & Predictive Analytics
Product Performance Analysis
Plan ahead with confidence using data-driven forecasts.
We provide:
Sales and demand forecasting to guide inventory and staffing.
Trend analysis to spot opportunities early.
Scenario planning for different market conditions.
Our predictive models help you reduce risk and seize opportunities.
Data Solutions Subscription
Unlock insights with our expert data services.

Dacriti transformed our data processes, making reporting and analysis seamless and efficient.
Alex P.

The team's expertise in KPI dashboards significantly improved our decision-making and performance tracking.
Jordan L.

★★★★★
★★★★★
Services
Expert data solutions for all your business needs.
Contact
Support
info@dacriti.com
+3706 080 1395
© 2025. All rights reserved.